Introduction
Recently, I attended a training related to ZK framework. One part of that training was quite interesting for me and was related to measuring and monitoring the performance of the web applications. In Chrome Browser, we have Chrome Dev Tools, which can be opened with Ctrl+Shift+I shortcut or ⌘+Shift+I shortcut on Mac. Inside these tools, we have “Performance” tab. We can hit red “record” icon in the upper left corner of the Tools window and start recording performance of the website while loading it, clicking around or whatever situation we want to monitor. After that, we can see a really nice graph.
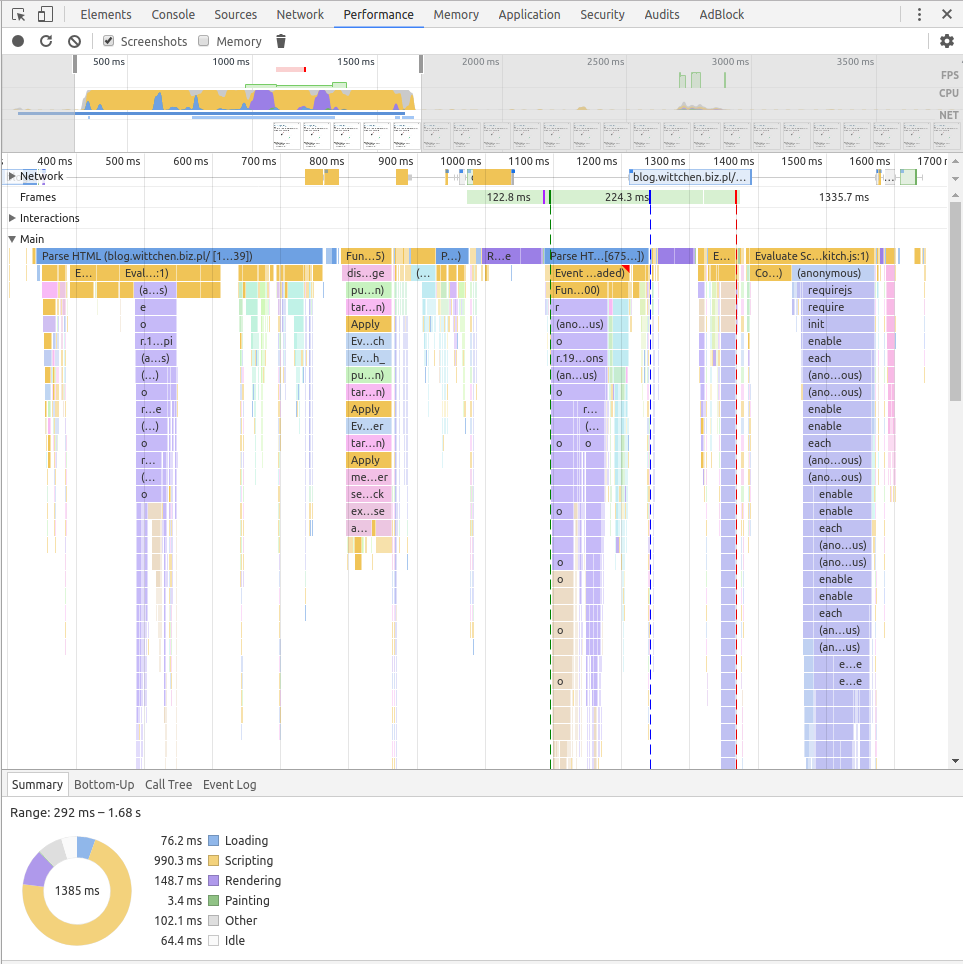
This graph presents a performance of our application during the time and shows different metrics divided into the different sections like:
- Loading
- Scripting
- Rendering
- Painting
- Other
- Idle
It can help us to find bottlenecks of the performance and critical sections.
Client-side performance issues
As we can see in this example, “Scripting” takes a lot of time so we can assume that client-side of our application slows down its performance. Moments, where application slowed down are marked with red lines on the main chart. We can select this area and investigate it further.

We could find the exact call of the JavaScript method and now we can try to optimize it in the future.
Server-side performance issues
When “Scripting” doesn’t take most of the time, but an application is still slow, we may suppose, that performance problem is caused by the server-side. In case of Java and JVM application, we can use JVisualVM program to monitor performance of our project. It can be subject of the separate article. In Chrome Dev Tools, we may also switch to the “Network” tab and mark “XHR” sub-tab, which stands for XML Http Request, which are usually AJAX network calls done via JavaScript to the server.
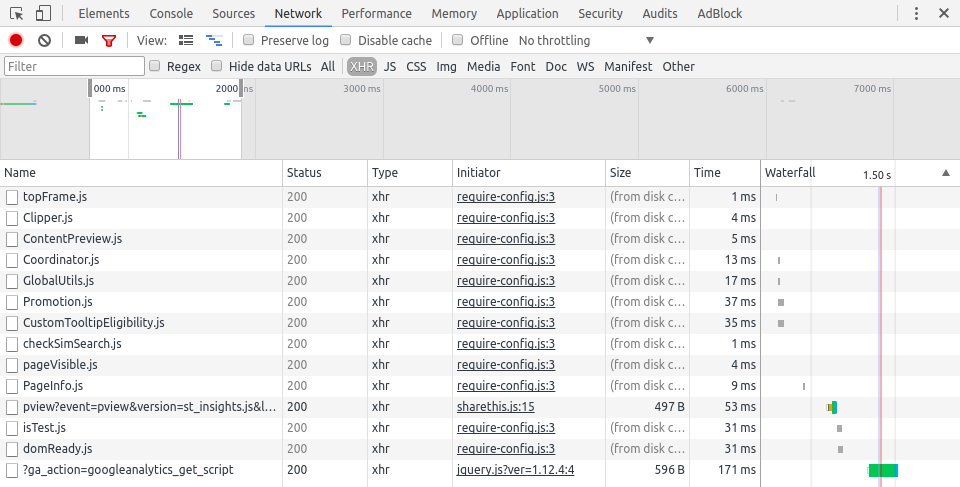
Next, we can review our request and check, which one is slow. We may also review its header and response.
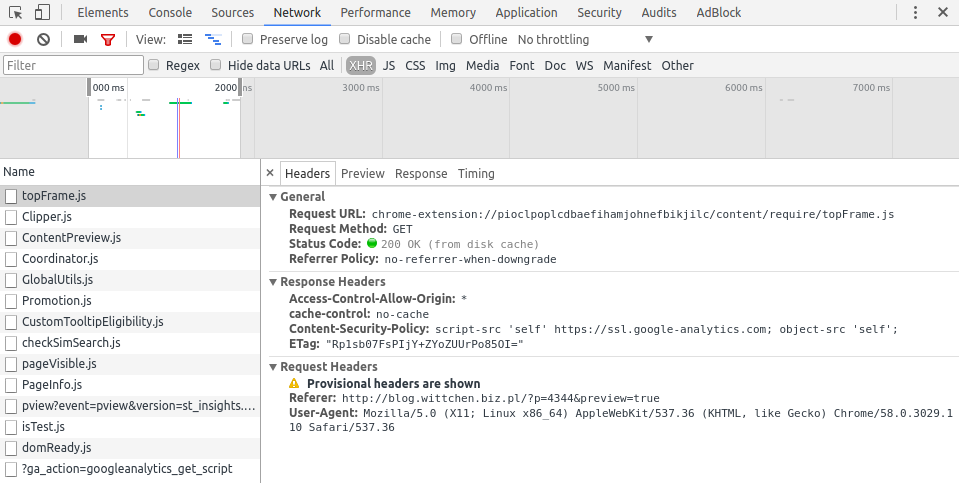
In the “Timing” tab we can take a look at the execution time of asynchronous connection. If it’s really slow, we may start the further investigation on the server-side in the place where this request is called.

Please note, slow XHR connections may be caused not only by inefficient code on the server-side but also by the infrastructure, servers & networking issues. We should isolate pieces of code & perform unit tests to show that it’s a server-side issue. We can also perform end-to-end tests, measure performance and compute average execution time to conclude what is the real source of the problem.
Summary
As we can see, monitoring performance and finding bottlenecks is not an easy task, but Chrome Dev Tools can help us to fix such issues in a really convenient way.