Introduction
Sometimes people send me e-mails concerning EEG Analyzer app. Usually they are not sure how to interpret or analyze results generated by the app and uploaded to Dropbox server. My app is quite “raw” and simple, because it is additional project created during writing my Master Thesis, which helped me to perform some experiments and analysis of EEG data. That’s why I didn’t focused on generating reports from gathered data. I focused only on reading and gathering data from MindWave Mobile device. In this article I’ll show you how to interpret data generated by EEG Analyzer and draw simple plots showing change of attention level, meditation level and blink strength.
Step #1 - download and install LibreOffice Calc
LibreOffice Calc is free software similar to MS Office. Currently, I’m using Linux, so I’ve chosen this tool, but if you are using MS Windows, you can perform similar operations in MS Office and MS Excel.
Step #2 - gather EEG and eye blinking data
Download EEG Analyzer app to your mobile device, connect it with MindWave, go to the settings and enable “Save EEG and eye blinking data” option. After that, go back to the main screen. Wait for some time and let the app record your EEG data. Next, go to the Settings screen again. You should see that “Number of the signals saved on the device” is greater than zero, so your data was recorded. Click button “Export data to Dropbox”. After that, you should see a message informing you that data was exported successfully.
Step #3 - access gathered and uploaded data
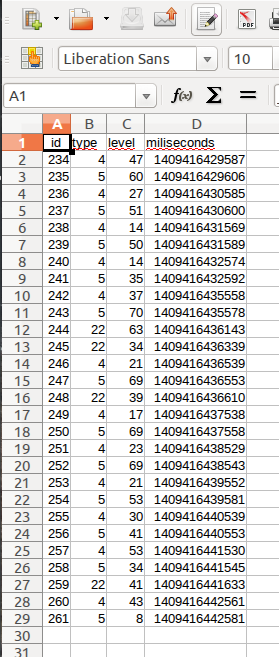
Go to your Dropbox directory on your disk or Dropbox website. Next, go to the “EEG_Analyzer” directory. You should see files containing your exported signals in that directory. Names of the files should look like that: egg_analyzer_data_20140830_183410.csv. First section with the numbers represents date. 20140830 means 30th of August 2014. Second section represents time. 183410 means 18:34, 10 sec. (6:34 PM, 10 sec.) When you open this file in a text editor, you should see something like in table below.
See raw *.csv file here.
"_id","type","level","miliseconds"
"234","4","47","1409416429587"
"235","5","60","1409416429606"
"236","4","27","1409416430585"
"237","5","51","1409416430600"
"238","4","14","1409416431569"
"239","5","50","1409416431589"
"240","4","14","1409416432574"
"241","5","35","1409416432592"
"242","4","37","1409416435558"
"243","5","70","1409416435578"
"244","22","63","1409416436143"
"245","22","34","1409416436339"
"246","4","21","1409416436539"
"247","5","69","1409416436553"
"248","22","39","1409416436610"
"249","4","17","1409416437538"
"250","5","69","1409416437558"
"251","4","23","1409416438529"
"252","5","69","1409416438543"
"253","4","21","1409416439552"
"254","5","53","1409416439581"
"255","4","30","1409416440539"
"256","5","41","1409416440553"
"257","4","53","1409416441530"
"258","5","34","1409416441545"
"259","22","41","1409416441633"
"260","4","43","1409416442561"
"261","5","8","1409416442581"
Values on the top describes contents of the columns. _id is id of the record in SQLite database table on the device, type represents type of the signal (4 - attention, 5 - meditation, 22 - blink strength), level represents attention level (from 0 to 100), meditation level (from 0 to 100) or blink strength (I don’t know maximum value, but it’s always positive integer value), milliseconds represents Unix Timestamp in milliseconds. We can extract date and time in many ways. E.g. using website currentmillis.com or by writing our own script, software or formula in spreadsheet software like LibreOffice or MS Excel.
Step #4 - open exported file in LibreOffice Calc and draw plots
Below, you can follow the steps, which allow you to analyze EEG data and generate plots presenting change of attention level, meditation level and blink strength in time. I am using Polish version of the Ubuntu and LibreOffice, but you can find the same options in your language in the same places.
Step #4.1 - open *.csv file with LibreOffice Calc

Step #4.2 - import data

Step #4.3 - display data
When you confirm importing of the data, you should see data in LibreOffice Calc.
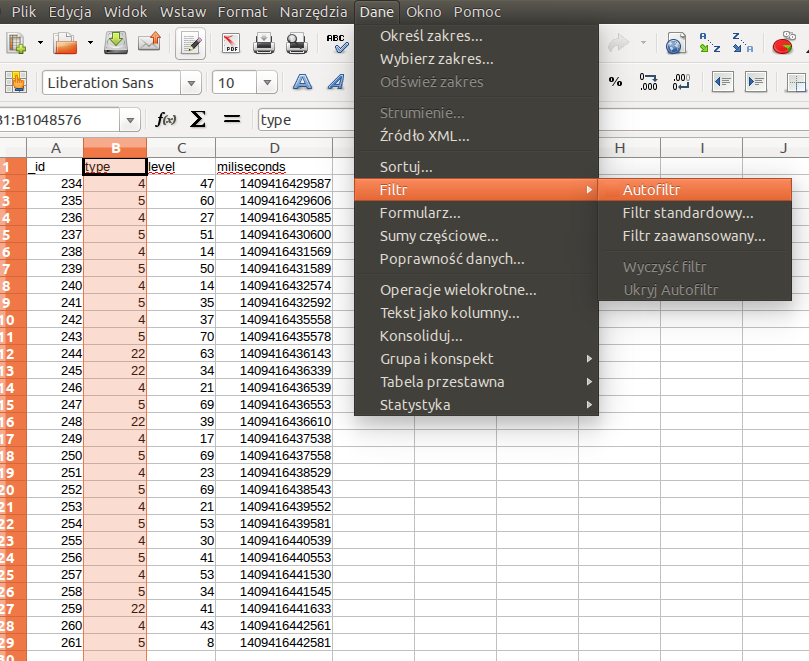
Step #4.4 - add data auto-filter
Mark “type” column and from menu choose “Data” » “Filter” » “Auto”.
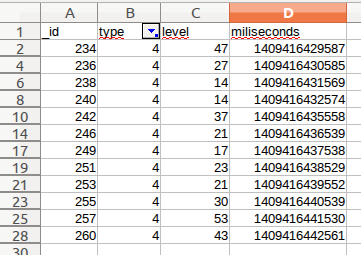
Step #4.5 - apply filter
After adding filter, you should see little arrow in the “type” column. When you click on the arrow you can filter all signals representing attention by choosing type = 4 and “unchecking” other types.

When you click “OK”, you should see only “attention” signals.
Step #4.6 - draw the chart
Choose option “Insert” » “Object” » “Chart (Plot)”
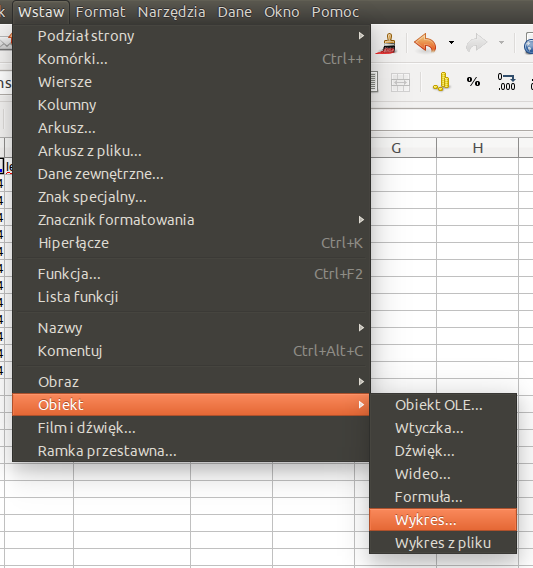
Or click on the icon:

Define initial plot parameters:

Click “Next” to see “Range of data”. Don’t do anything and click “Next” again. Click “Add” below “Data series” field.
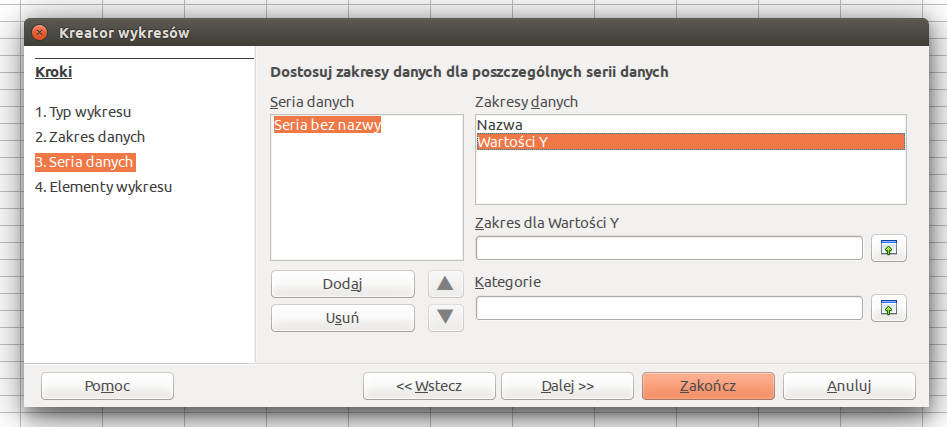
Click “choose data range for Y values” and mark values in the “level” column.

Afterwards, you can click “Next” and adjust Chart parameters.
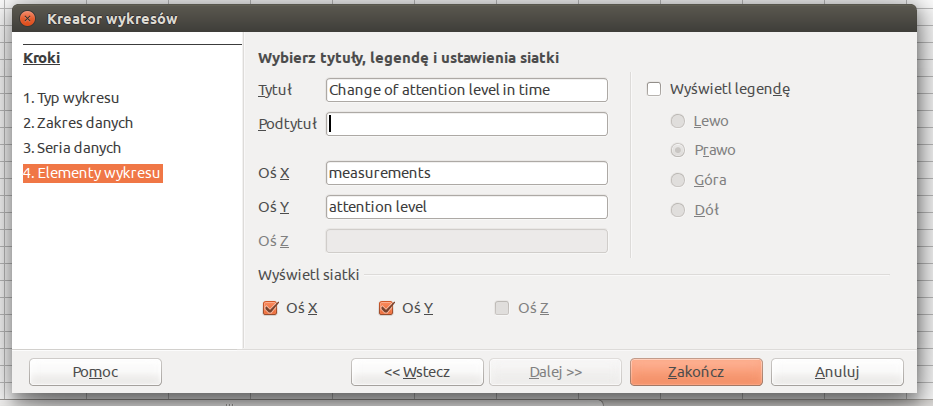
Click “Finish” and your chart is ready.

You can draw plots of change of meditation level and eye blink strength in time in the same way by filtering other signals. I hope this tutorial is useful for you and clears up doubts connected with data generated by EEG Analyzer. In addition it shows simple way of generating plot of the attention level change in time what can be useful for displaying EEG data in a graphical way.